I am a data scientist/analyst with 1.5 years of professional experience. I have cut excess product inventory spending using ARIMA forecasting with sales data. I am able to quickly adapt and apply new knowledge and techniques. Supervisors say I am responsible and efficient while on the job and working with others.
Data science makes the impossible possible; it is a combination of statistics and machine learning. We can examine data sets with millions of entries and extract meaning from them in the form of predictive models. The applications of data science are endless and have no bounds; we can examine topics in biology to topics in business to topics in logistics and so on.
Email: jonjkick@gmail.com

Examples of my work:
Predicting Used Car Prices
Image Classification Using Convolutional Neural Network
STEM Workforce Analysis Tableau Dashboard
Sales Forecasting
A car dealership wanted to be able to predict the price of used cars based on factors such as year, mileage, fuel type, etc. The data set used had over 5,000 rows. Here is a snapshot of the data set to get an idea of what it looks like:
I used this data to train 3 different regression models including linear regression, decision tree regression, and random forest regression in python. Here are scatter plots of each model showing predicted values vs actual values:
The random forest model’s predicted values are closer to the actual values than the other models. The random forest model also has the highest accuracy out of the three models (an accuracy of 90.8%). Therefore, the random forest model is the best out of the three and is the model to use for predicting the used car prices. Data from: https://www.kaggle.com/datasets/sujay1844/used-car-prices
Needed a way to classify pictures as either being dogs, cars, or food from a data set of 30,000 images with equal amounts of each image type.
Here is a bar graph illustrating how many of each image type are in the data set:
Built a convolution neural network (CNN) in python using AlexNet architecture and 50 epochs. Here is an image of the CNN’s architecture:
The CNN successfully classified the images with a training accuracy of 93.8% and a test accuracy of 89.52 %.
Data from: https://image-net.org/index.php
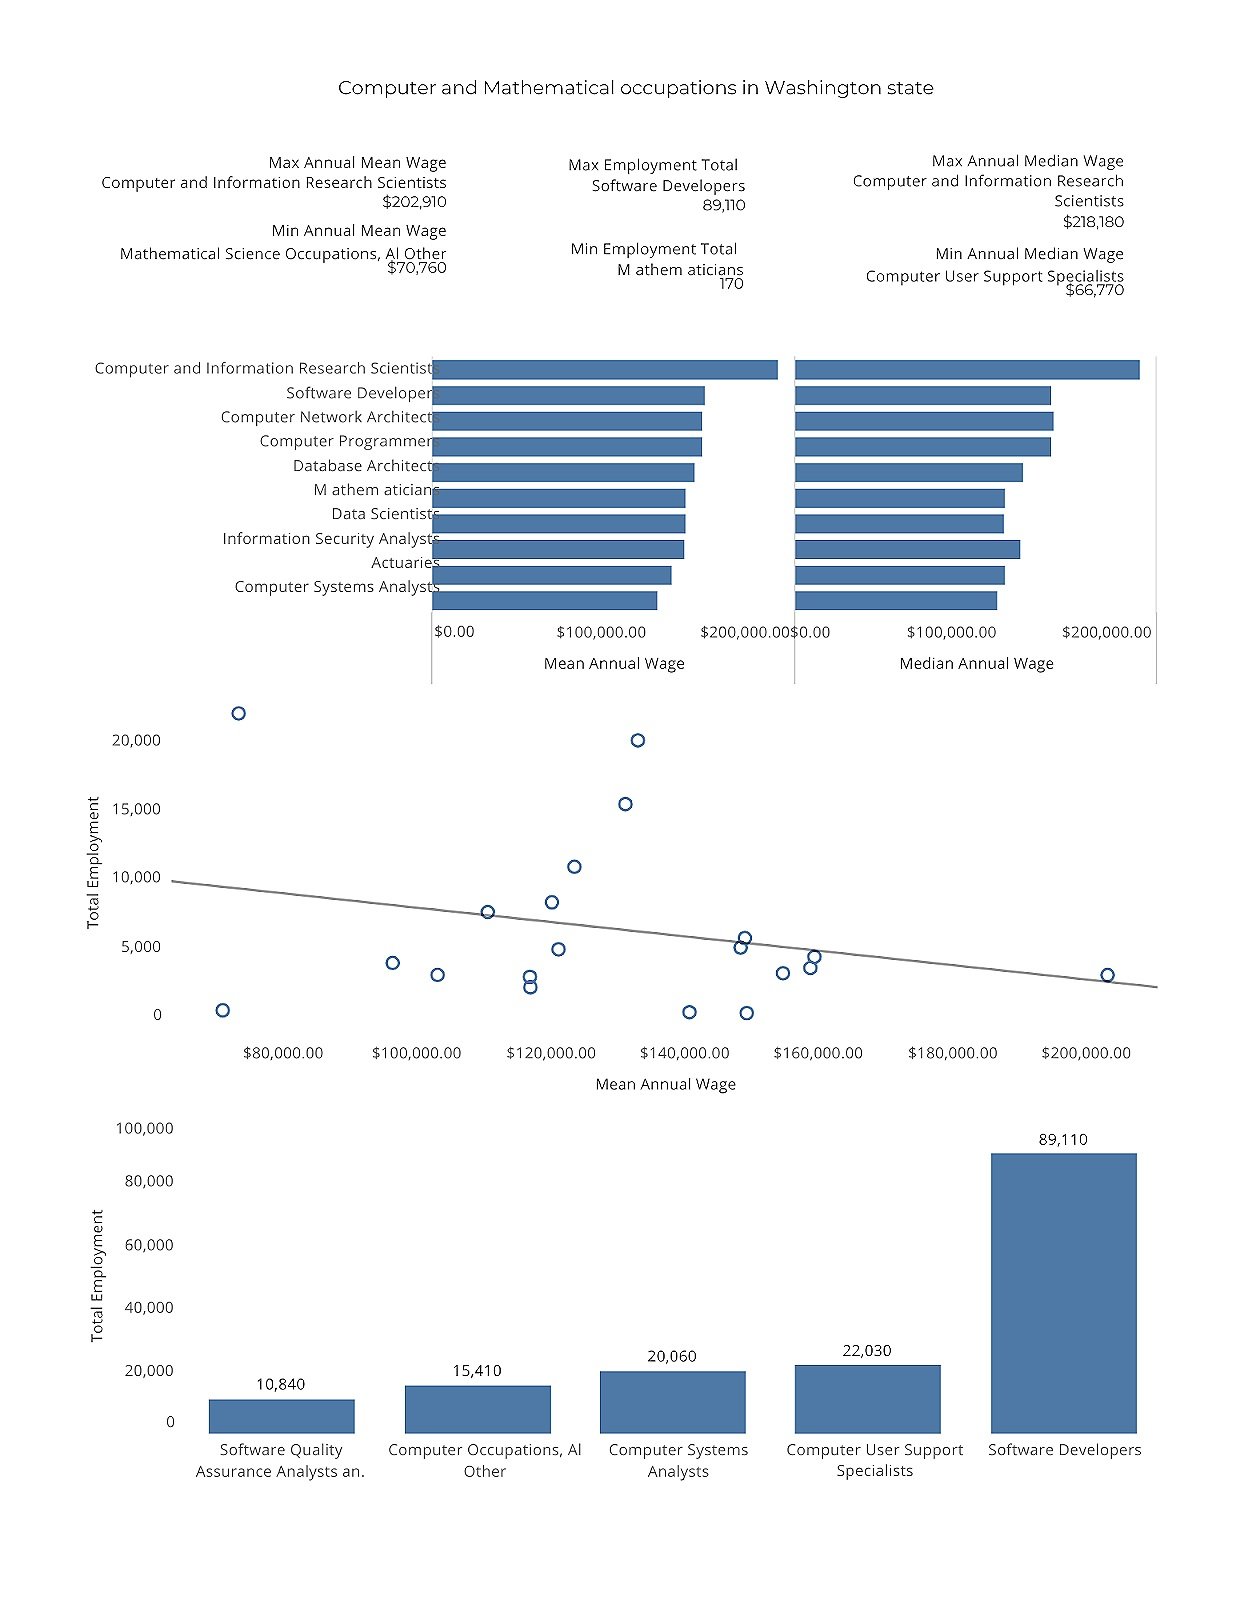
Needed to discover relevant employment trends and economic information for STEM employees in the state of Washington using data including over 100,000 employees. Created a dashboard with 3 bar graphs, 1 scatter plot, and 6 statistics illustrating the state of STEM employment being saturated by mostly software engineers earning between $100,000 and $140,000 per year which may make it difficult for new people to enter the STEM workforce because of competition.
Here is the dashboard:
Converting the pdf of the dashboard into a png made some strange errors to the dashbaord, so here is a link to the dashboard for a clearer image: https://drive.google.com/file/d/1XyU7_2T2es6MpohZSSmDj_etjSNIGET9/view?usp=sharing
This project involved analyzing sales data from Walmart and building a model in order to forecast the next year’s sales. This data is weekly sales data from a Walmart store between 2010 and 2013. Here is a plot of the data:
I then built an ARIMA model in python to be able to forecast the weekly sales for Walmart. Here is a plot of the model’s forecast compared to the actual sales data:
This model has an accuracy of 96.26% (based on its mean absolute percentage error value). Here is a plot of a 1 year forecast of sales:


